When you run a business in Romania, understanding how your assets generate profit becomes essential for the strategic decisions you make every day.
Return on Assets (ROA), as it is known in the international financial environment, provides you with a clear perspective on how efficiently your company turns every leu invested in equipment, buildings, inventory, or other resources into concrete financial results.
This indicator is not just a number in financial reports – it is a true compass that guides you in evaluating operational financial performance and identifying optimization opportunities.
For entrepreneurs who want to grow their business or prepare it for a stock exchange listing, understanding and monitoring this indicator becomes a fundamental element of their growth strategy.
Summary
- ROA measures how efficiently your company turns its total assets into net profit and provides you with a clear picture of operational performance.
- The ROA formula is calculated as net profit divided by average total assets, and the accuracy of the analysis depends on using the correct values from the income statement and the balance sheet.
- ROA analysis should be complemented with indicators such as net profit margin, asset turnover, liquidity, leverage, and ROE in order to assess the sustainability of financial performance.
- The difference between ROA and ROE highlights the impact of the financing structure, and the use of debt can amplify the return on equity beyond the level of return on assets.
- Improving ROA is achieved by increasing net profit and optimizing asset utilization, through cost reduction, accelerating inventory turnover, faster collection of receivables, and eliminating underperforming assets.
Table of Contents
- What is ROA or Return on Assets for Entrepreneurs.
- ROA Formula and Calculation of the Economic Return on Assets.
- Complementary Financial Indicators to ROA in Balance Sheet Analysis of Company Performance.
- ROA vs ROE – Differences and Applicability for Entrepreneurs.
- Interpretation and Benchmarking of ROA for Romanian Companies.
- Strategies to Improve ROA for Entrepreneurs.
What is ROA or Return on Assets for Entrepreneurs
Return on assets is a financial indicator that measures your company’s ability to generate profit from all the resources it owns.
Unlike other metrics that focus exclusively on sales or equity, this indicator – ROA – shows you how productive each asset on your balance sheet is, from machinery and equipment used in production to inventory and receivables from customers.
For you, as an entrepreneur, the ROA indicator becomes relevant when you want to understand whether the investments you’ve made in assets are generating the expected returns.
For example, if you have invested in a new production line or expanded your storage space, return on assets will show you whether these investments are actually contributing to the growth of your business’s profitability.
In the context of the Romanian market, where access to financing and operational efficiency are critical success factors, monitoring this ROA indicator helps you make more informed decisions about resource allocation and your company’s development directions.
So, what is ROA? In essence, ROA provides you with an objective view of management performance in using available resources.
- A high ROA indicates that your team is successfully extracting maximum value from each asset.
- A low ROA may signal the need to optimize operational processes or reconsider your investment strategy.
This becomes particularly important when you compare your company’s performance with that of competitors in the industry or when evaluating opportunities for expansion, attracting investors, or going public on the stock exchange.
ROA Formula and the Calculation of the Economic Return on Assets
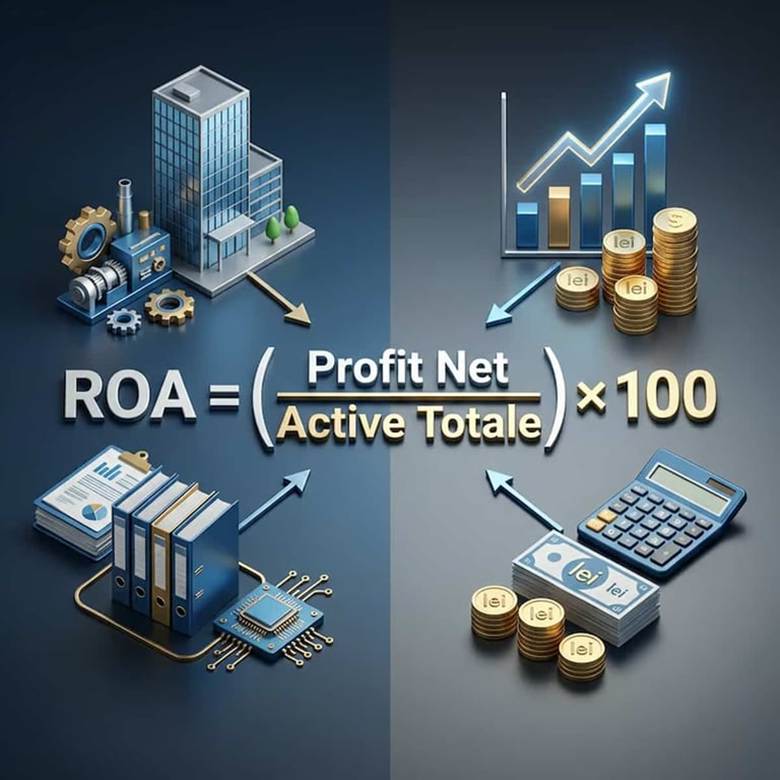
The calculation of return on assets is based on a simple ROA formula, yet highly relevant for analyzing your business performance.
The standard formula is as follows: you divide the company’s net profit by the total value of its assets and multiply the result by 100 to obtain a percentage.
Thus, for example, if your company generated a net profit of 500,000 lei and holds total assets worth 5,000,000 lei, the return on assets will be 10%.
To correctly apply the ROA formula, you need to identify two essential elements from your company’s financial statements.
- The first element is net profit, which you can find in the income statement – it represents the final result after deducting all operating, financial, and tax expenses from total revenues.
- The second element consists of total assets from the balance sheet analysis, which include both current and non-current assets, such as cash, inventory, and receivables, as well as land, buildings, equipment, and long-term investments.
When performing a balance sheet analysis to determine the value of assets, it is important to use an average value over the analyzed period, not just the value at the end of the year.
Your company’s assets fluctuate over time – you purchase new equipment, sell inventory, collect receivables – and using an average provides a more accurate picture of the resources you actually had available to generate that profit.
You can calculate this average by adding the value of assets at the beginning of the period to the value at the end of the period and dividing the result by two.
In practice, applying the ROA formula requires attention to detail.
- Net profit must correspond to the analyzed period – usually a full fiscal year – to ensure comparability with other periods or companies.
- If you are analyzing quarterly performance, you will use quarterly net profit, but you will need to adjust comparisons to reflect the seasonality of your business.
- Total assets must include all elements from the balance sheet analysis, without exceptions, in order to obtain a complete picture of the resource base your company uses to generate profit.
Complementary Financial Indicators to ROA in the Balance Sheet Analysis of a Company’s Financial Performance
Although return on assets provides valuable insights, a comprehensive balance sheet–based analysis of your company’s financial performance requires evaluating several complementary financial indicators. Each of these reveals a different dimension of your business’s financial health and helps you identify both strengths and areas that need improvement.
Net profit margin shows you what percentage of each leu of revenue turns into final profit after covering all costs.
- This indicator is closely linked to return on assets.
- A higher profit margin directly contributes to improving asset returns.
Asset turnover, another essential indicator.
- It measures how many times per year you are able to generate revenues equivalent to the total value of your assets.
- The faster this turnover, the more productive your assets are.
Additionally, understanding the break-even point is essential to determine the moment when your business starts generating profit.
Return on equity (ROE) complements the picture provided by return on assets by focusing specifically on the return generated on shareholders’ investment.
Current and quick liquidity ratios show your company’s ability to meet its short-term obligations, while the level of indebtedness informs you about the balance between debt financing and equity financing.
For companies aiming to go public, these financial indicators become even more relevant, as investors carefully analyze them to assess the attractiveness of the investment.
A combined profitability analysis of these financial indicators allows you to understand not only current financial performance but also its long-term sustainability.
For example, a high ROA accompanied by low liquidity may signal that, although your assets are productive, your company is facing challenges in managing cash flow.
Consistently monitoring this set of indicators provides you with a holistic view of your business’s financial health.
ROA vs ROE – Differences and Applicability for Entrepreneurs
When analyzing your company’s financial performance, you will often encounter two indicators that may seem similar but measure different aspects of economic profitability: return on assets (ROA), which we have just discussed, and return on equity (ROE).
Understanding the difference between them helps you more accurately assess operational efficiency and the impact of the financing structure on your business results.
Return on assets, as you have already seen, shows how efficiently you use all of your company’s resources – regardless of whether they are financed through equity or debtto generate profit. It is an indicator of pure operational efficiency, reflecting management’s ability to turn assets into financial results.
On the other hand, return on equity focuses exclusively on the return on your investment and – that of other shareholders, showing how much profit is generated for each leu of equity invested in the business.
The difference between these two indicators becomes significant when your company uses debt financing.
- If you have taken out bank loans or issued bonds to finance expansion, ROE can be significantly higher than ROA, as you are using borrowed funds to amplify the return on equity.
- This difference signals the level of financial leverage you are using.
For your entrepreneurial decisions, ROA is more useful when evaluating operational efficiency and comparing economic profitability with other companies in the industry, while ROE becomes relevant when analyzing investment attractiveness for shareholders or when preparing to attract new investors.
In practice, both indicators are important and complement each other.
- A strong ROA demonstrates that your business efficiently generates profit from the resources it uses, regardless of its financing structure.
- A high ROE shows that shareholders’ investment delivers an attractive return.
When evaluating financing or investment opportunities, analyzing the profitability of both indicators provides you with a comprehensive perspective on how your financial decisions impact the company’s performance.
Interpretation and Benchmarking of ROA for Romanian Companies
Proper interpretation of return on assets requires context and comparison with relevant benchmarks from the Romanian market. An ROA of 8% may be excellent in one industry and insufficient in another, while the specifics of the local economy significantly influence the values considered strong for companies in Romania.
For publicly listed companies, the analysis of return on assets becomes an important element in investors’ evaluation.
- You can compare your company’s financial performance with the average of the BET index or with direct competitors in the same sector to determine whether you are above or below the industr benchmark.
- This comparison provides insights into the relative efficiency of your operations and may signal the need for strategic adjustments.
When interpreting the values of this indicator for your company, also consider the trend over multiple years, not just the value from a single financial period.
- A steadily increasing return on assets suggests improving operational efficiency and a stronger ability to generate profit from existing resources.
- Conversely, a downward trend may signal issues in asset utilization, pressure on profit margins, or recent investments that have not yet generated the expected returns, especially in the context of business volatility during periods of economic uncertainty.
For a comprehensive profitability analysis, always compare your performance with at least 3-5 relevant competitors in your industry and with the sector average over a period of at least three years.
Strategies to Improve ROA for Entrepreneurs
Improving your company’s return on assets can be approached through two main directions: increasing net profit or optimizing the use of existing assets. Both directions require a careful analysis of current operations and the implementation of concrete measures tailored to the specifics of your business.
The first strategy focuses on increasing profitability without proportionally increasing the asset base.
- You can achieve this by improving profit margins-either by increasing prices where the market allows or by reducing operating costs.
- Optimizing performance through a detailed analysis of your cost structure can reveal opportunities for efficiency improvements:
- negotiating better terms with suppliers;
- optimizing utility consumption;
- automating certain manual processes;
- outsourcing non-essential activities that consume resources without adding significant value.
The second direction focuses on using the assets you already own more efficiently.
- If you have equipment operating below capacity, identify ways to use it more intensively -perhaps by diversifying your product range or providing services to third parties during idle periods.
- More efficient inventory management, by implementing just-in-time systems or improving sales forecasting, can significantly reduce capital tied up in goods.
- Accelerating receivables collection, through stricter credit policies or by offering incentives for early payments, frees up financial resources that can be reinvested productively.
A complementary strategy involves critically evaluating assets that do not contribute sufficiently to generating profit.
- If you own outdated equipment, unused properties, or investments that do not generate the expected returns, selling them can simultaneously improve return on assets and generate resources for more productive investments.
- When making new investments in assets, make sure to rigorously assess their potential to generate additional revenue and ensure they align with your company’s growth strategy.
Consistently monitoring this indicator and adjusting your financial strategies based on the results will help you maintain an upward trajectory in financial performance.
Return on Assets represents much more than a simple financial indicator in accounting reports. It is a strategic tool that helps you assess how efficiently your company turns resources into concrete results. By understanding the calculation formula, correctly interpreting the values within the context of your industry, and implementing optimization strategies, you can make more informed entrepreneurial decisions that support the sustainable growth of your business.
Integrating the analysis of this indicator into your decision-making process means consistently monitoring performance, comparing results with relevant benchmarks from the Romanian market, and adjusting operational strategies to maximize the return on assets.
Whether your goal is to improve operational efficiency, attract investors, or prepare your company for a stock exchange listing, this indicator provides valuable insight into the financial health of your business. For support in these efforts, you can rely on the expertise of VERTIK, one of Romania’s leading companies offering capital market consulting services for attracting investors or going public.
The next step is to calculate the return on assets for your company, identify areas for improvement, and implement concrete measures that will contribute to business growth and long-term financial performance.